Datacenter Infrastructure Real-time Monitoring and Analytics
BVQ for IBM PowerVM
BVQ is an automated monitoring solution for cross-platform infrastructure. BVQ enables the automated monitoring of your entire data center including the computing IBM PowerVM platform, SAN and storage layers as an end-to-end solution.
- Home
- BVQ for IBM PowerVM
End-to-End Analytics
Turn Infrastructure Data into Answers
-
BVQ informs about performance issues and optimization possibilities using aggregated data and correlations from all layers of your data center
-
Uses real-time performance data
-
Reporting, alerting and analysis functions
-
Intelligent connection to ITSM systems including ServiceNow
- Automated Monitoring
- Cross-Platform

Understand How Your Workloads are Impacting the Performance of the
IBM PowerVM Environment
Data is collected, correlated and integrated to provide insight into the performance and condition of the IBM PowerVM infrastructure, as well as IBM Storage and storage area network (SAN Brocade and Cisco).
What data is collected and how?
BVQ collects topology and performance data. The data is collected via the IBM Power Systems HMC REST API. An agent needs to be installed on each Linux or AIX instance that collects performance and topology information that aren't available via HMC.
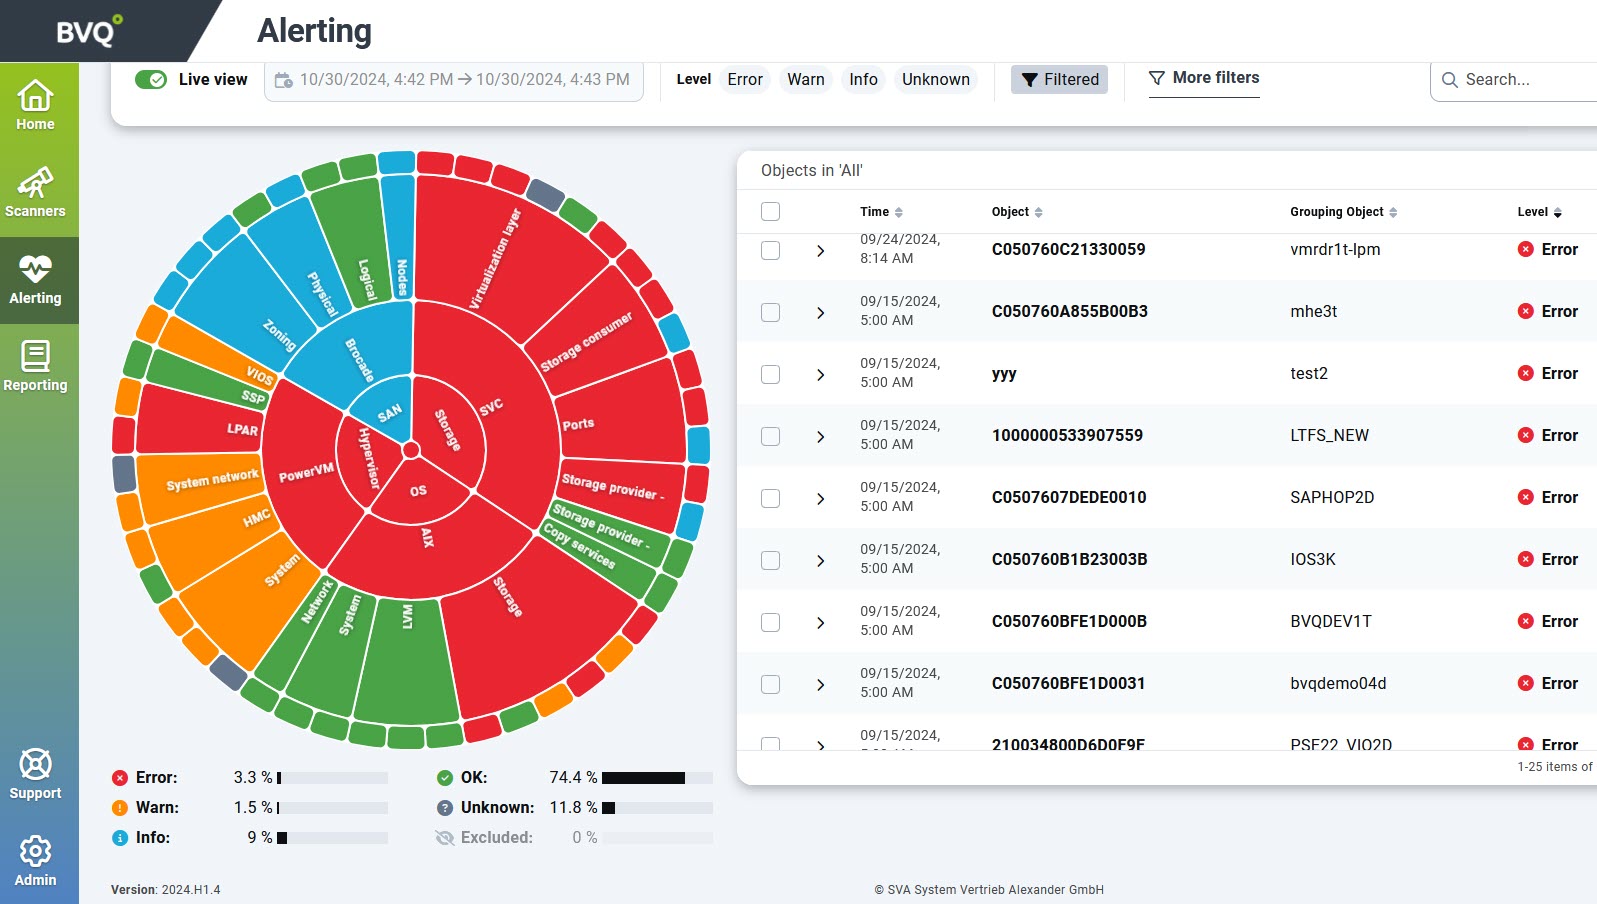
Systems Health Map
Automated IT Health Status for IBM PowerVM
With the BVQ Systems Health Map, visualize the IT health status of the IBM PowerVM, identify critical issues that need to be worked on, see what components are affected and how to proceed next to mitigate risks. From a single pane, identify critical issues from across all IT layers for an end-to-end health status of Storage and SAN.
BVQ is constantly checking for errors in these main areas:
-
Violations in best practices configuration
-
System limits
-
Performance
Find the root-cause of performance issues
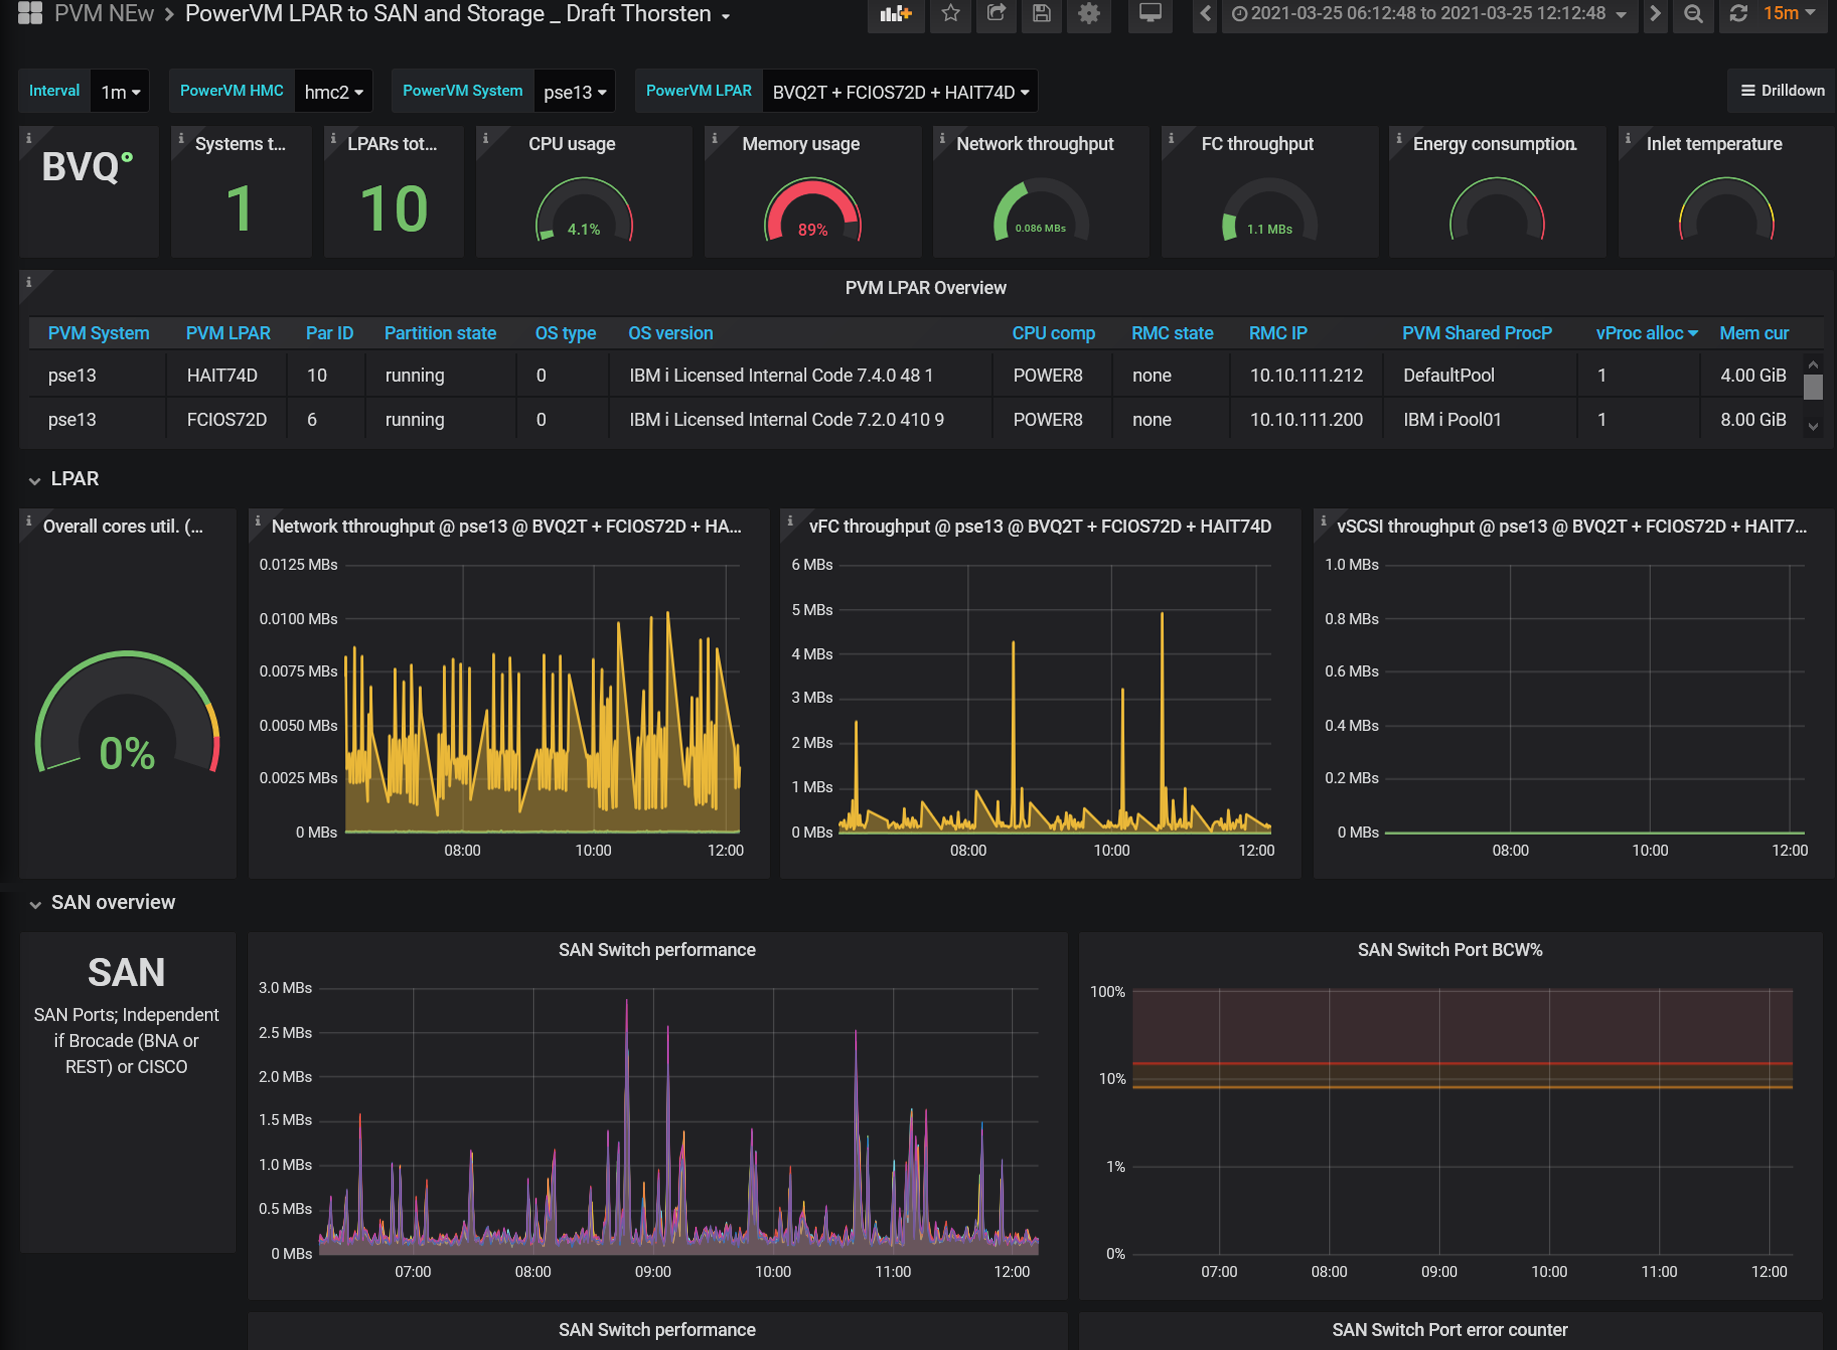
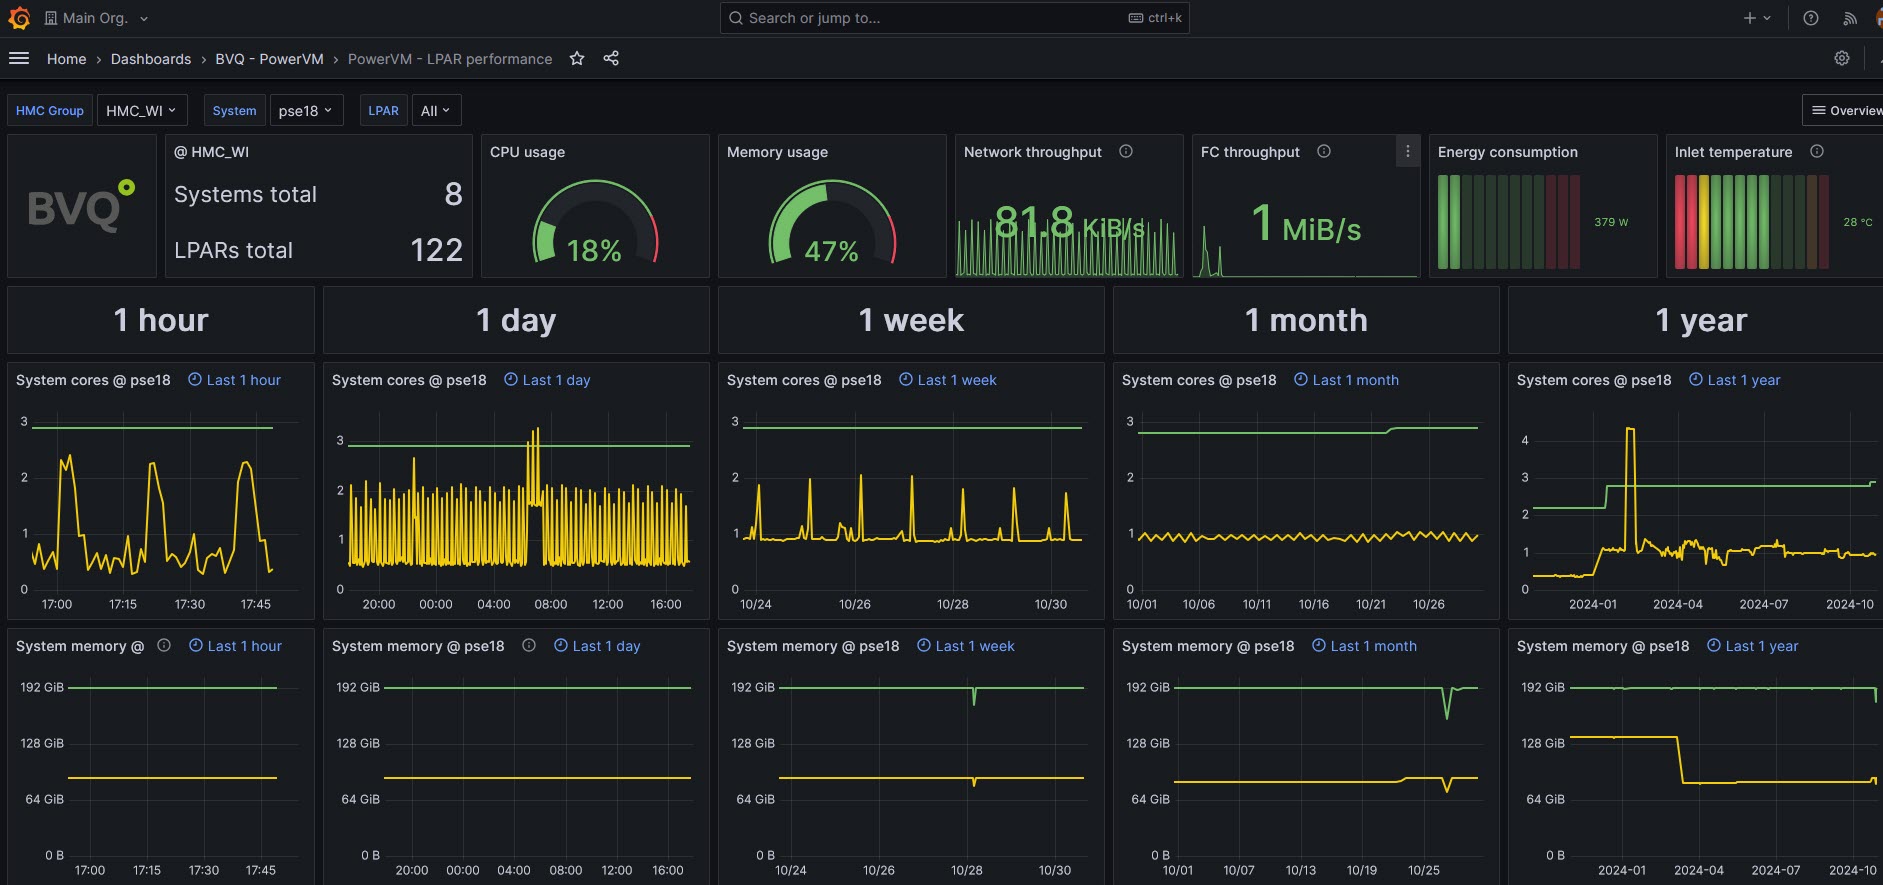
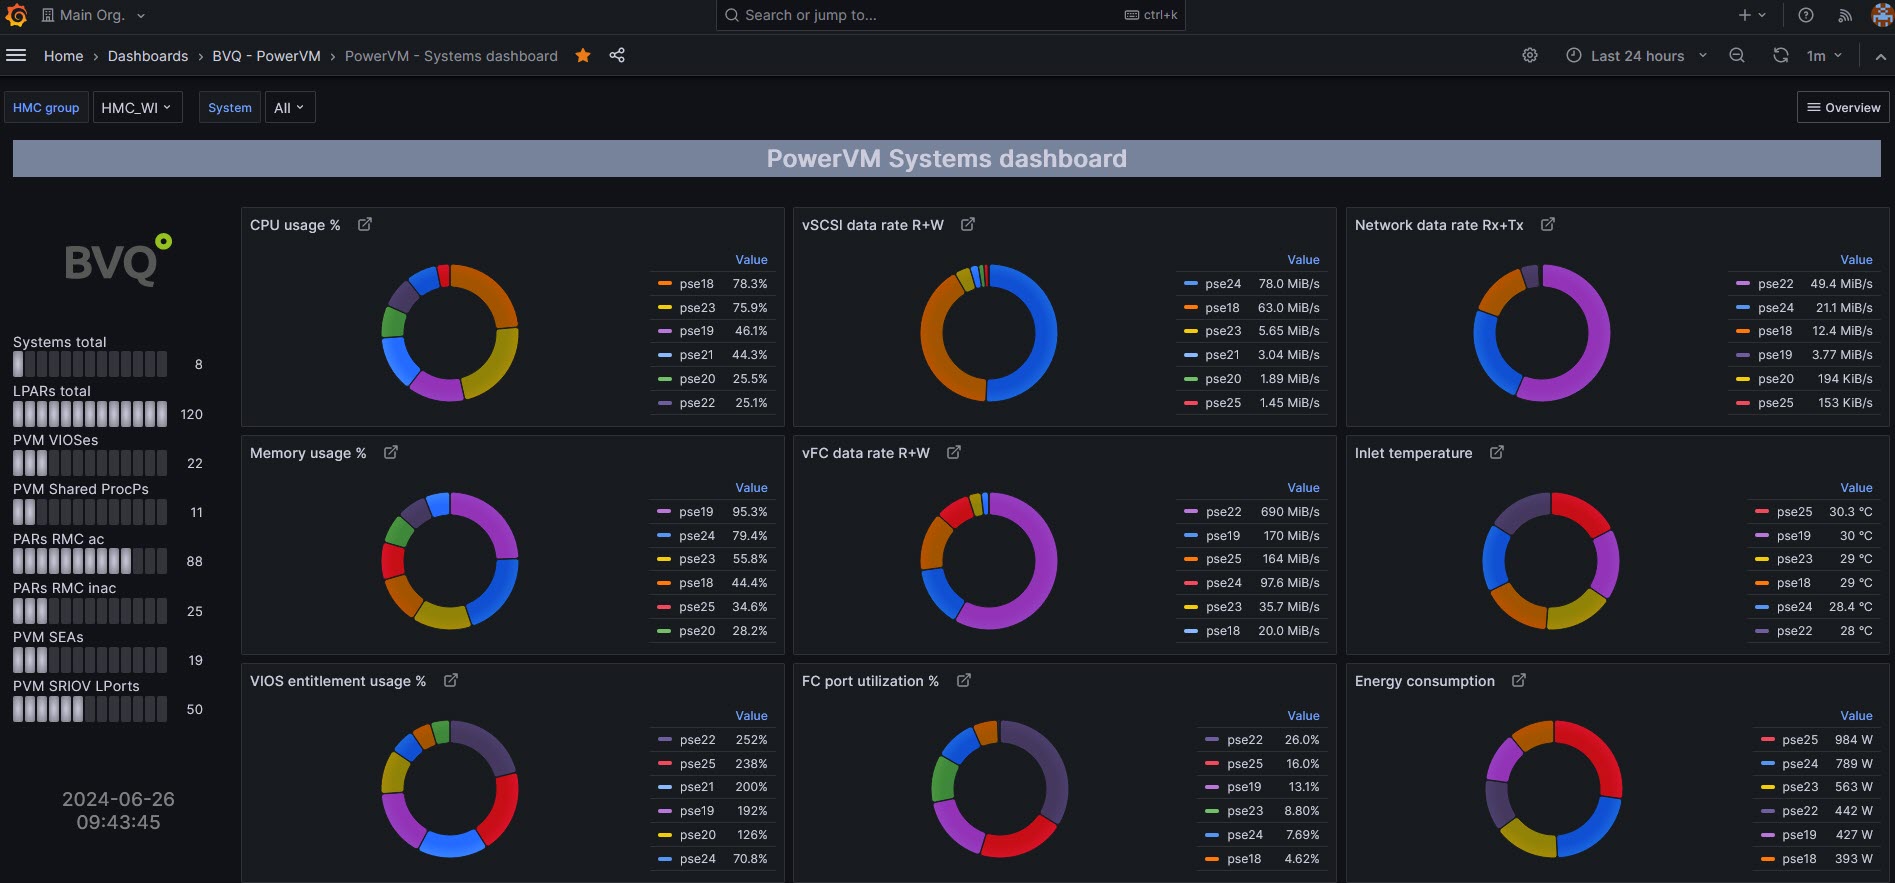
Ready-to-go Monitoring Dashboards -powered by Grafana
Out of the box dashboards with views and metrics to enable the IT team to immediately identify bottlenecks in the IBM Systems, LPARs/VMs, storage volumes or SAN ports.
Gain insight into:
-
Physical resources at the system level
-
Virtual resources at the LPAR level
-
OS AIX & Linux level
-
Real time and historical views
-
End-to-end view of the data path troubleshooting
Reporting
Reports to Keep Management Informed
Share reports efficiently by email or an HTML link that loads the latest data at any time. These reports can be scheduled, generated HTML or PDF file formats. The universal REST interface from BVQ makes it easy to use tools like Excel, Power BI or any tool that can read in data via REST.
Stabilize and improve performance based on the insights gained from these metrics at the System, LPARs/VMs, VIOs, AIX & Linux OS level
Resources
Metrics
Processor
System Cores entitled/utilized
Core Usage
LPAR/VM Cores entitled/utilized
Logical CPU
vCPU utilization*
Memory
System Memory activated, allocated
LPAR Logical Memory (GB)
Paging Space activity and space usage*
Network
System network throughput
VM network throughput
Data Transfer & Data Rate
vFC throughput*
Data Transfer & Data Rate
Disk
Run Queue, rperf *
Disk usage throughput and IO/s*
VIOS
Core, memory and throughput
Power Consumption
System energy consumption & temperature
Supported Platforms
All Features
Discover everything
you can do with BVQ for IBM PowerVM
Explore all the features and use cases of BVQ to turn your infrastructure data into answers.
Visualization
Smart cross-platform monitoring dashboards and reports equip you with pertinent insights and adaptability.
Troubleshooting
Experience hassle-free troubleshooting across all infrastructure layers, both automated and on-demand, simplifying problem identification and offering solutions.
Capacity & Cost Analysis
Our monitoring, reporting, and analytics tools empower you to oversee your infrastructure around the clock and optimize resource utilization.
Automated Workload Monitoring
Streamline infrastructure management with automatic notifications of workload shifts and immediate alerts at the first sign of an issue.
Performance Analysis
With our multi-platform analysis, you gain a comprehensive view of your entire infrastructure’s performance, along with insights into the interplay between platforms and layers.
Forecast & Planning
Analytics and real-time analysis offer a solid foundation for decision-making, whether planning a migration, forecasting resources, or considering procurement.
Seamless Integrations
BVQ Enterprise streamlines the integration with ITSM systems for incident management, such as ticketing systems, enterprise monitoring tools like Splunk, Elastic, and Grafana, as well as asset management solutions like CMDBs and ServiceNow.
Unified Dashboard
BVQ seamlessly integrates with orcharhino, offering a unified dashboard for simultaneous VM analysis. This integration equips you with streamlined monitoring and troubleshooting capabilities, combining two powerful tools in one convenient, efficient location.
An End-to-End & Comprehensive ITSM
Optimize your IT infrastructure
with BVQ today
Benefit from a unified infrastructure view and integrated expert guidelines, promoting optimal performance and best practice adherence. Contact us today!


