IT Infrastructure Analytics
Monitor VMware with BVQ
BVQ collects topology and performance data, then correlates and integrates this data to provide insight into the performance and condition of the VMware/vSAN infrastructure.
- Home
- Monitor VMWare with BVQ
Save Time Looking for the Status of the Critical Areas
See the VMware/vSAN Environment Information You Really Need
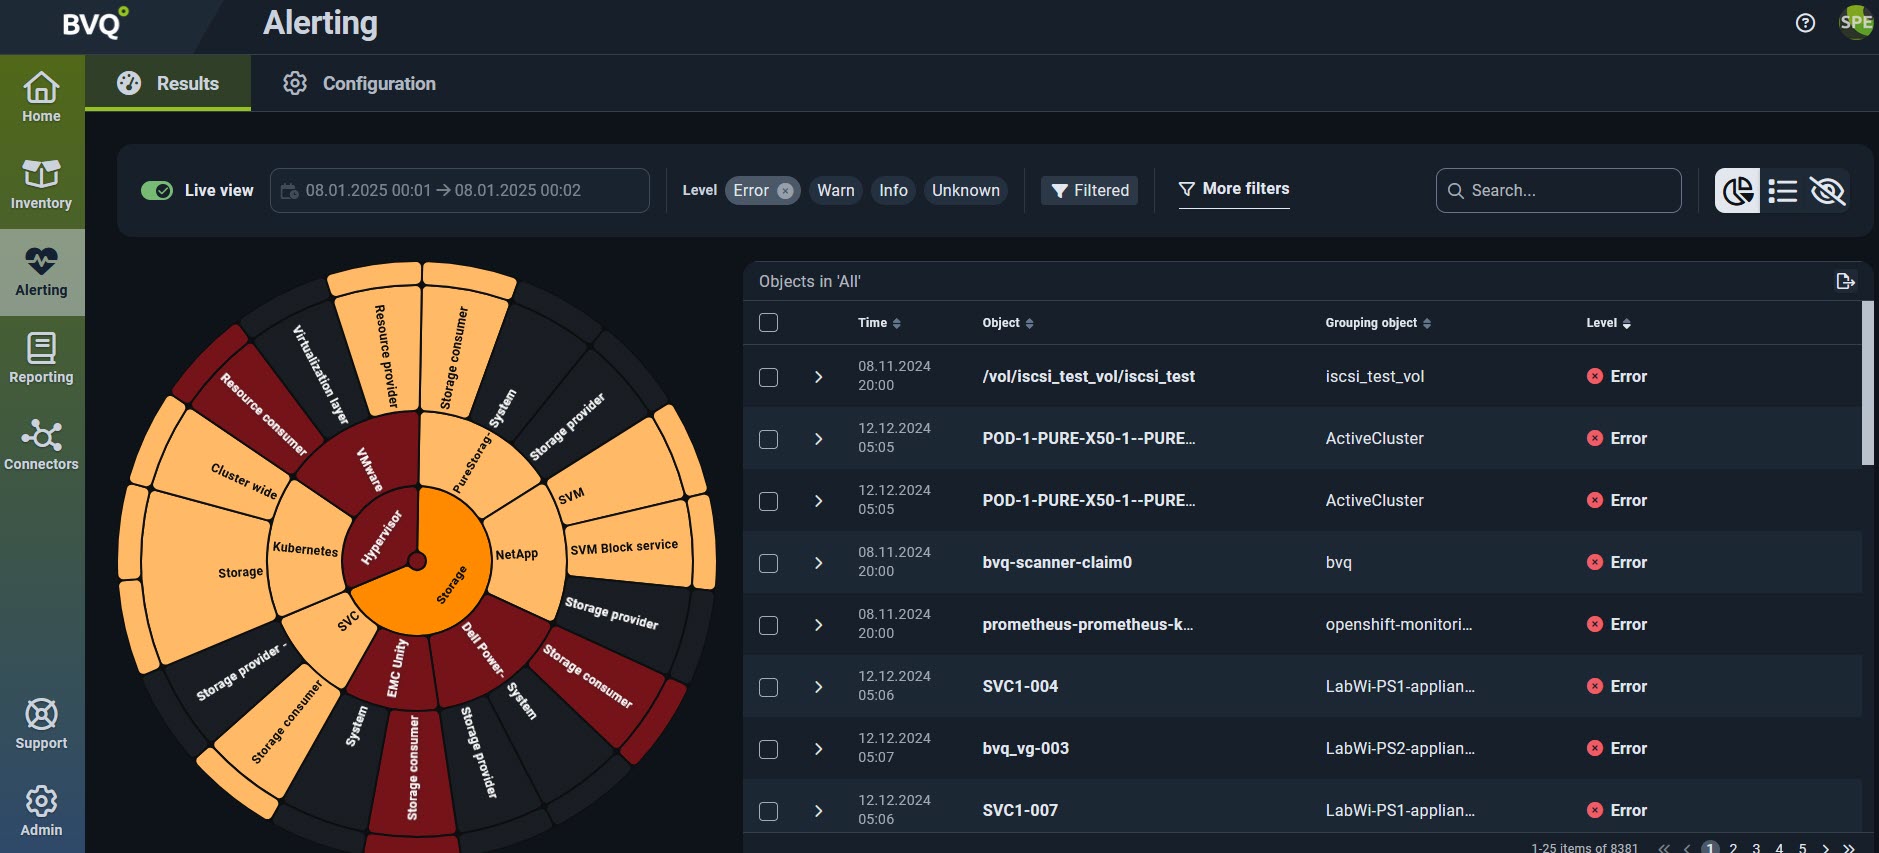
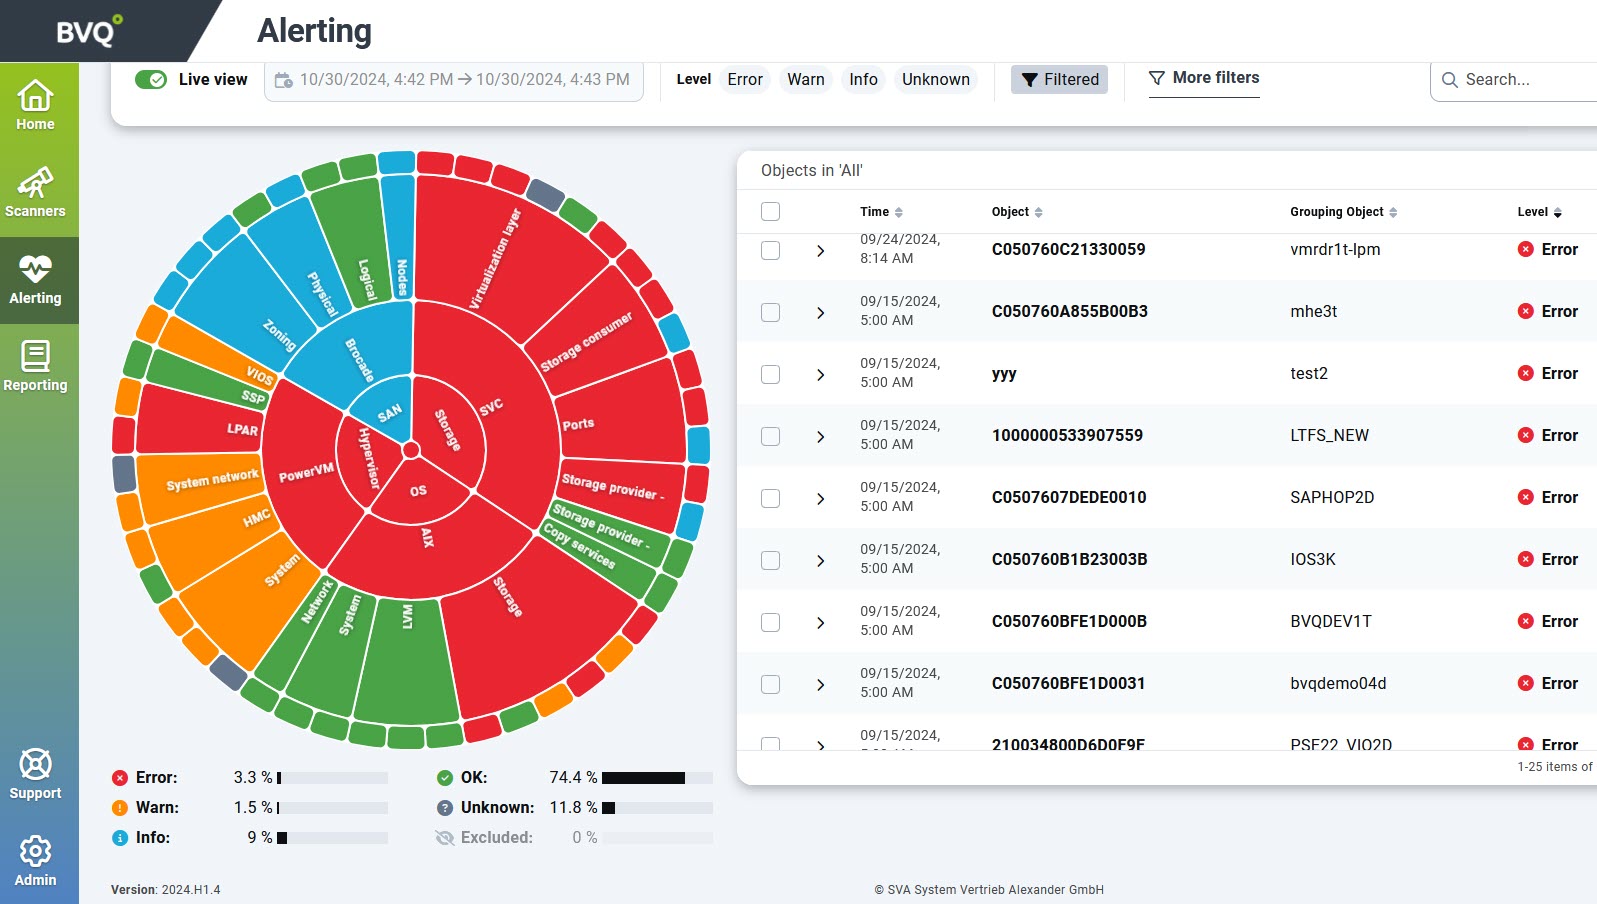
Stabilize the VMware environment and provide the resources when needed with alerting and the traffic- light visualization of the BVQ Systems Health Map.
- Real-time alerting
- Cross-Platform
Understand How Your Workloads are Impacting the Performance of the
VMware environment
BVQ takes away the complexity of monitoring and diagnosing problems in a VMware and Storage environment because both teams look at the same performance data and can see what is going on between both layers very quickly.
Not only that, but they are able to correlate critical performance metrics between both layers seamlessly. This enables the identification of performance issues right away; this is essential to ensure optimal operation of your virtual environment.
What data is collected?
Topology and performance data is collected and correlated to provide insight into the performance and condition of the VMware/vSAN environmentas as well as the Storage (NetApp ONTAP Storage).
Systems Health Map
Automated IT Health Status for VMware
The BVQ Systems Health map is your daily activity guide to help stabilize the environment. BVQ has an end-to-end view that constantly checks the VMware environment and the connected storage and SAN infrastructure.
Hundreds of pre-defined alerts give you immediate insight, so the IT team can focus on areas that need to be stabilized first and what needs to be worked on next with ‘expert knowledge’ and use-cases.
BVQ is constantly checking for errors in these main areas:
-
Violations in best practices configuration
-
System limits
-
Resource performance
-
Provisioning: Check and reclaim unused resources
-
Capacity usage status
Ensure optimal operation of your virtual environment
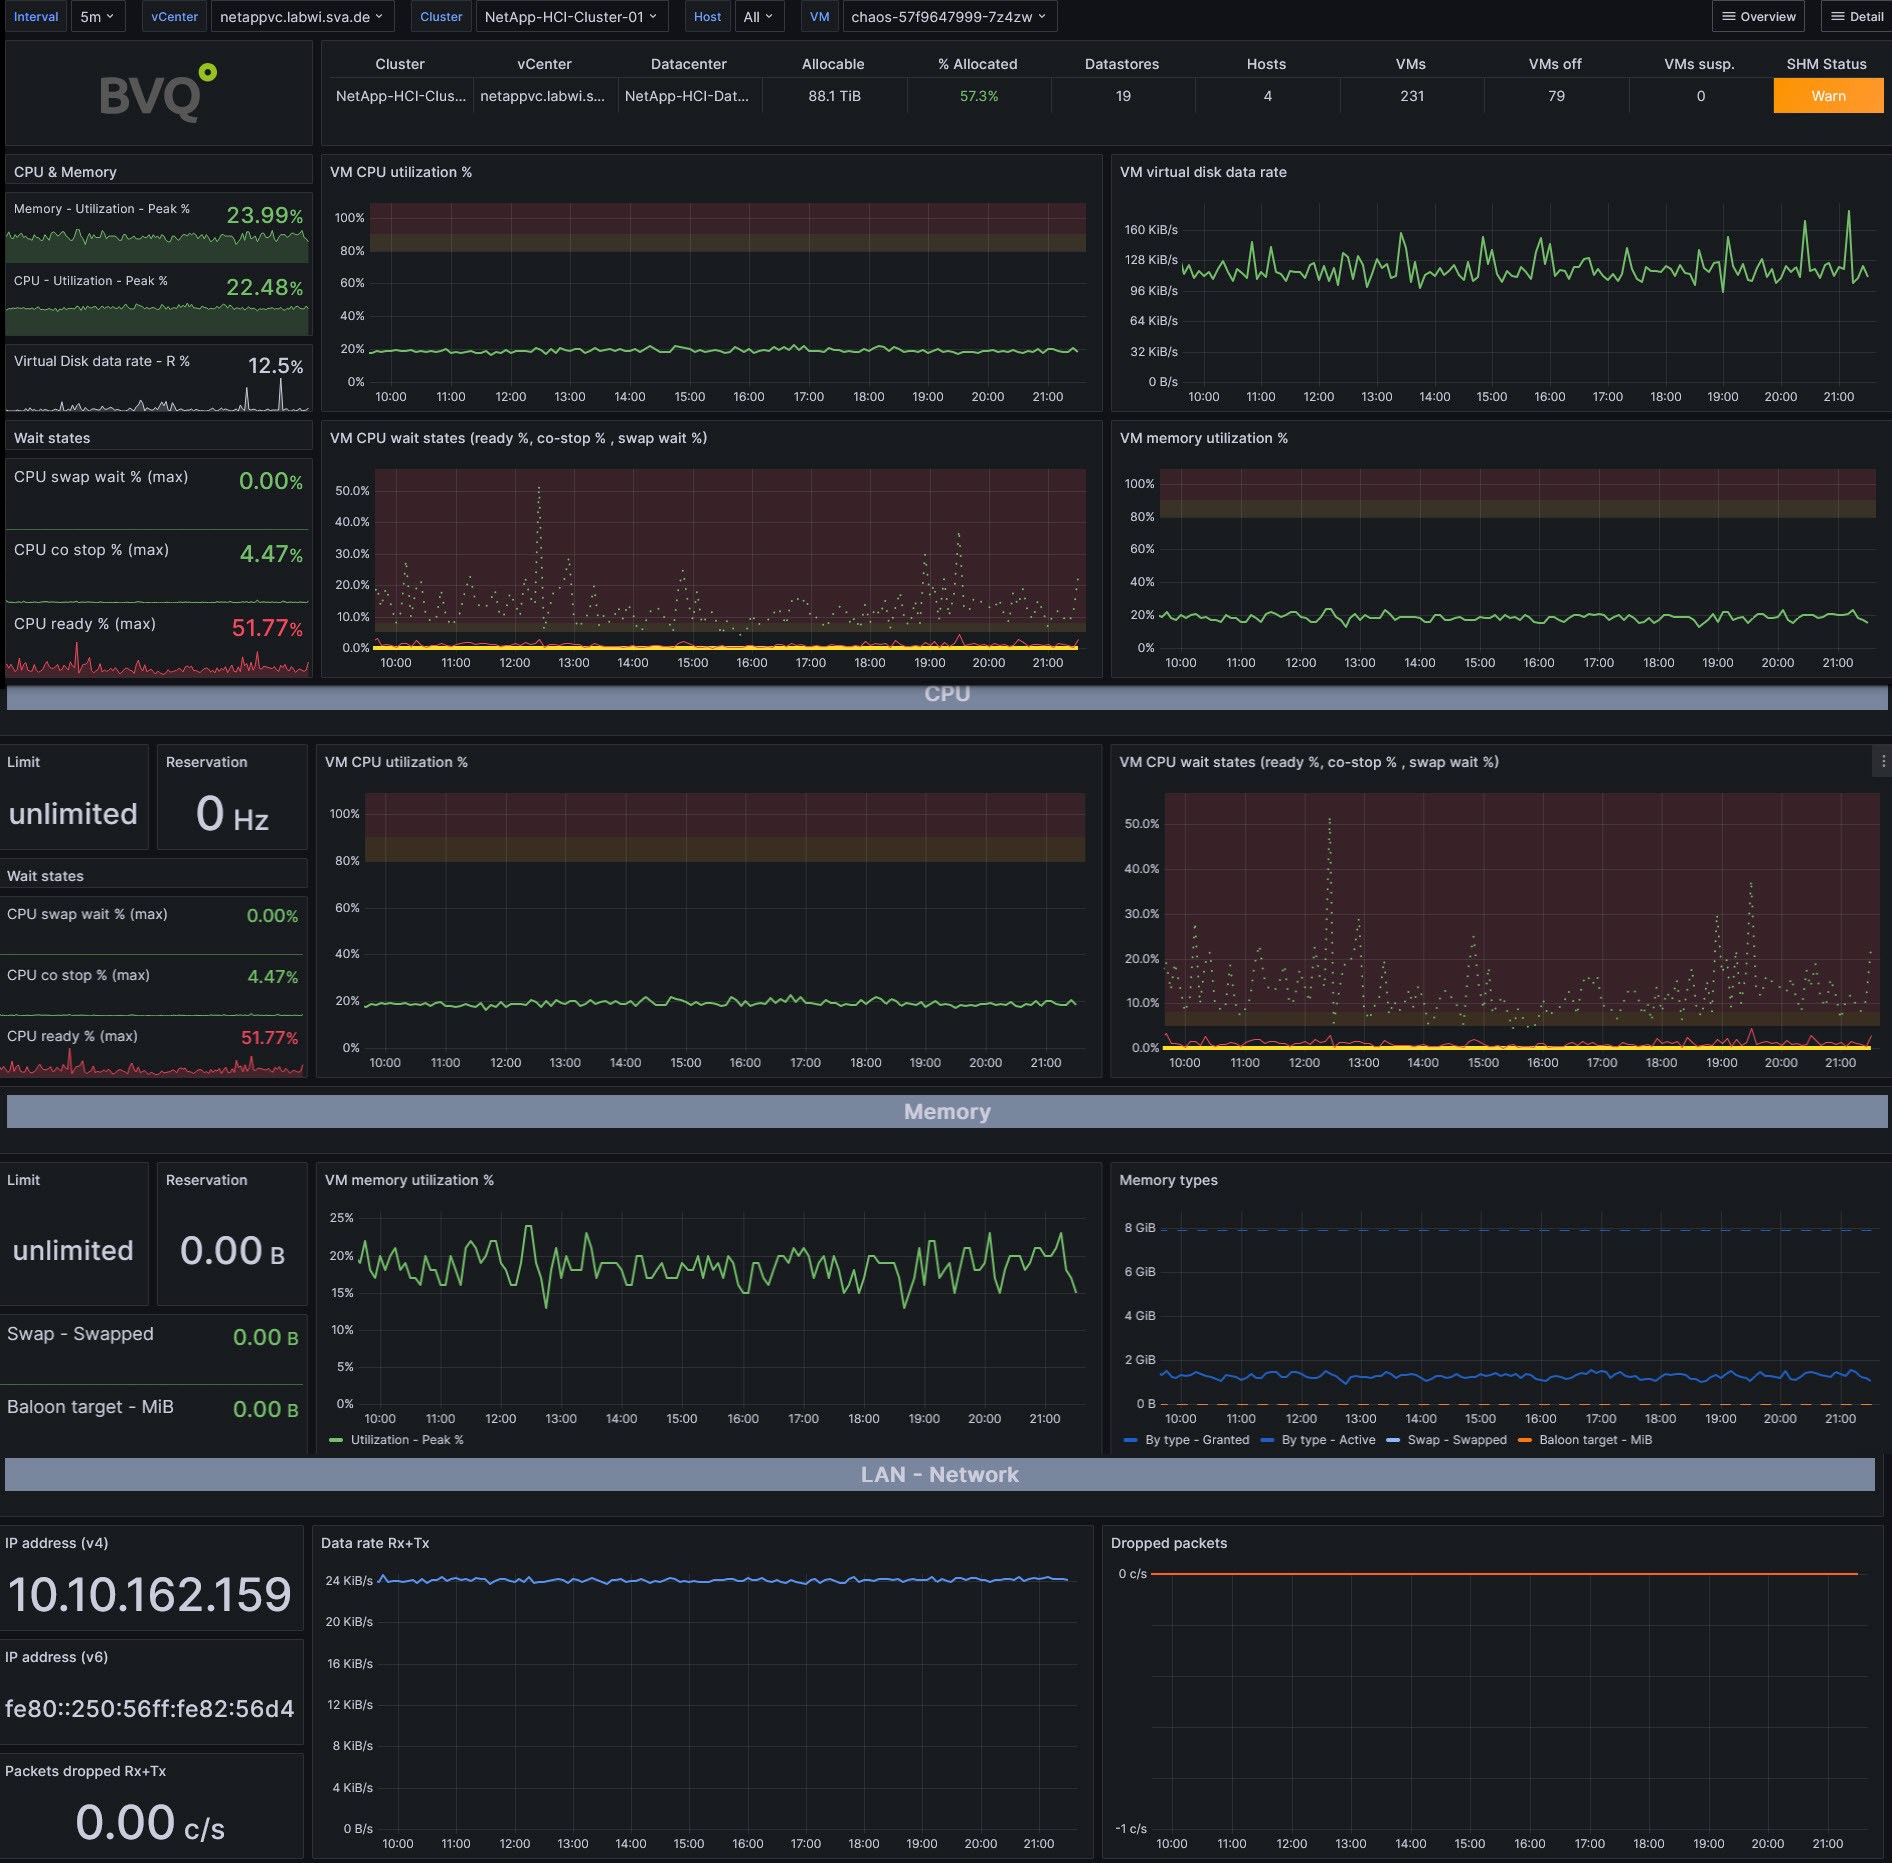
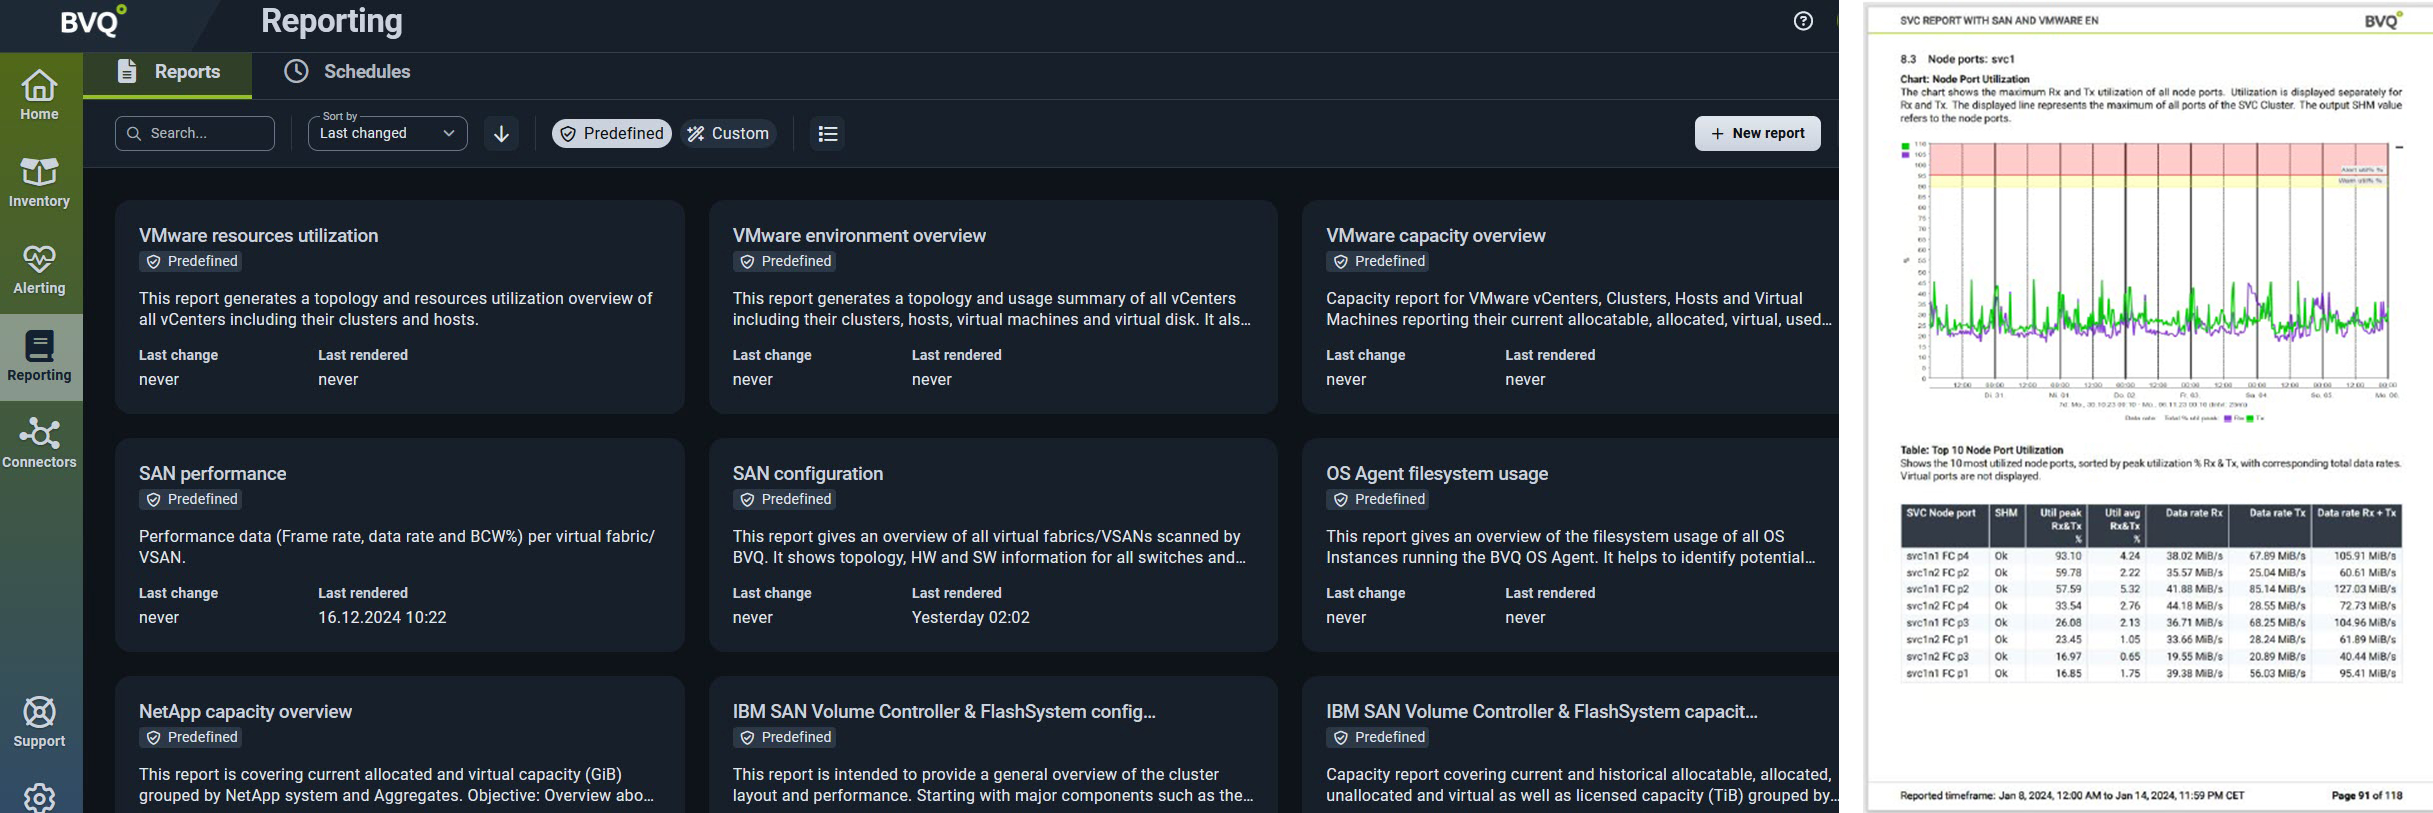
Ready to use Monitoring Dashboards
The day-to-day challenges IT teams deal with can become more real when you are dealing with external storage as well.
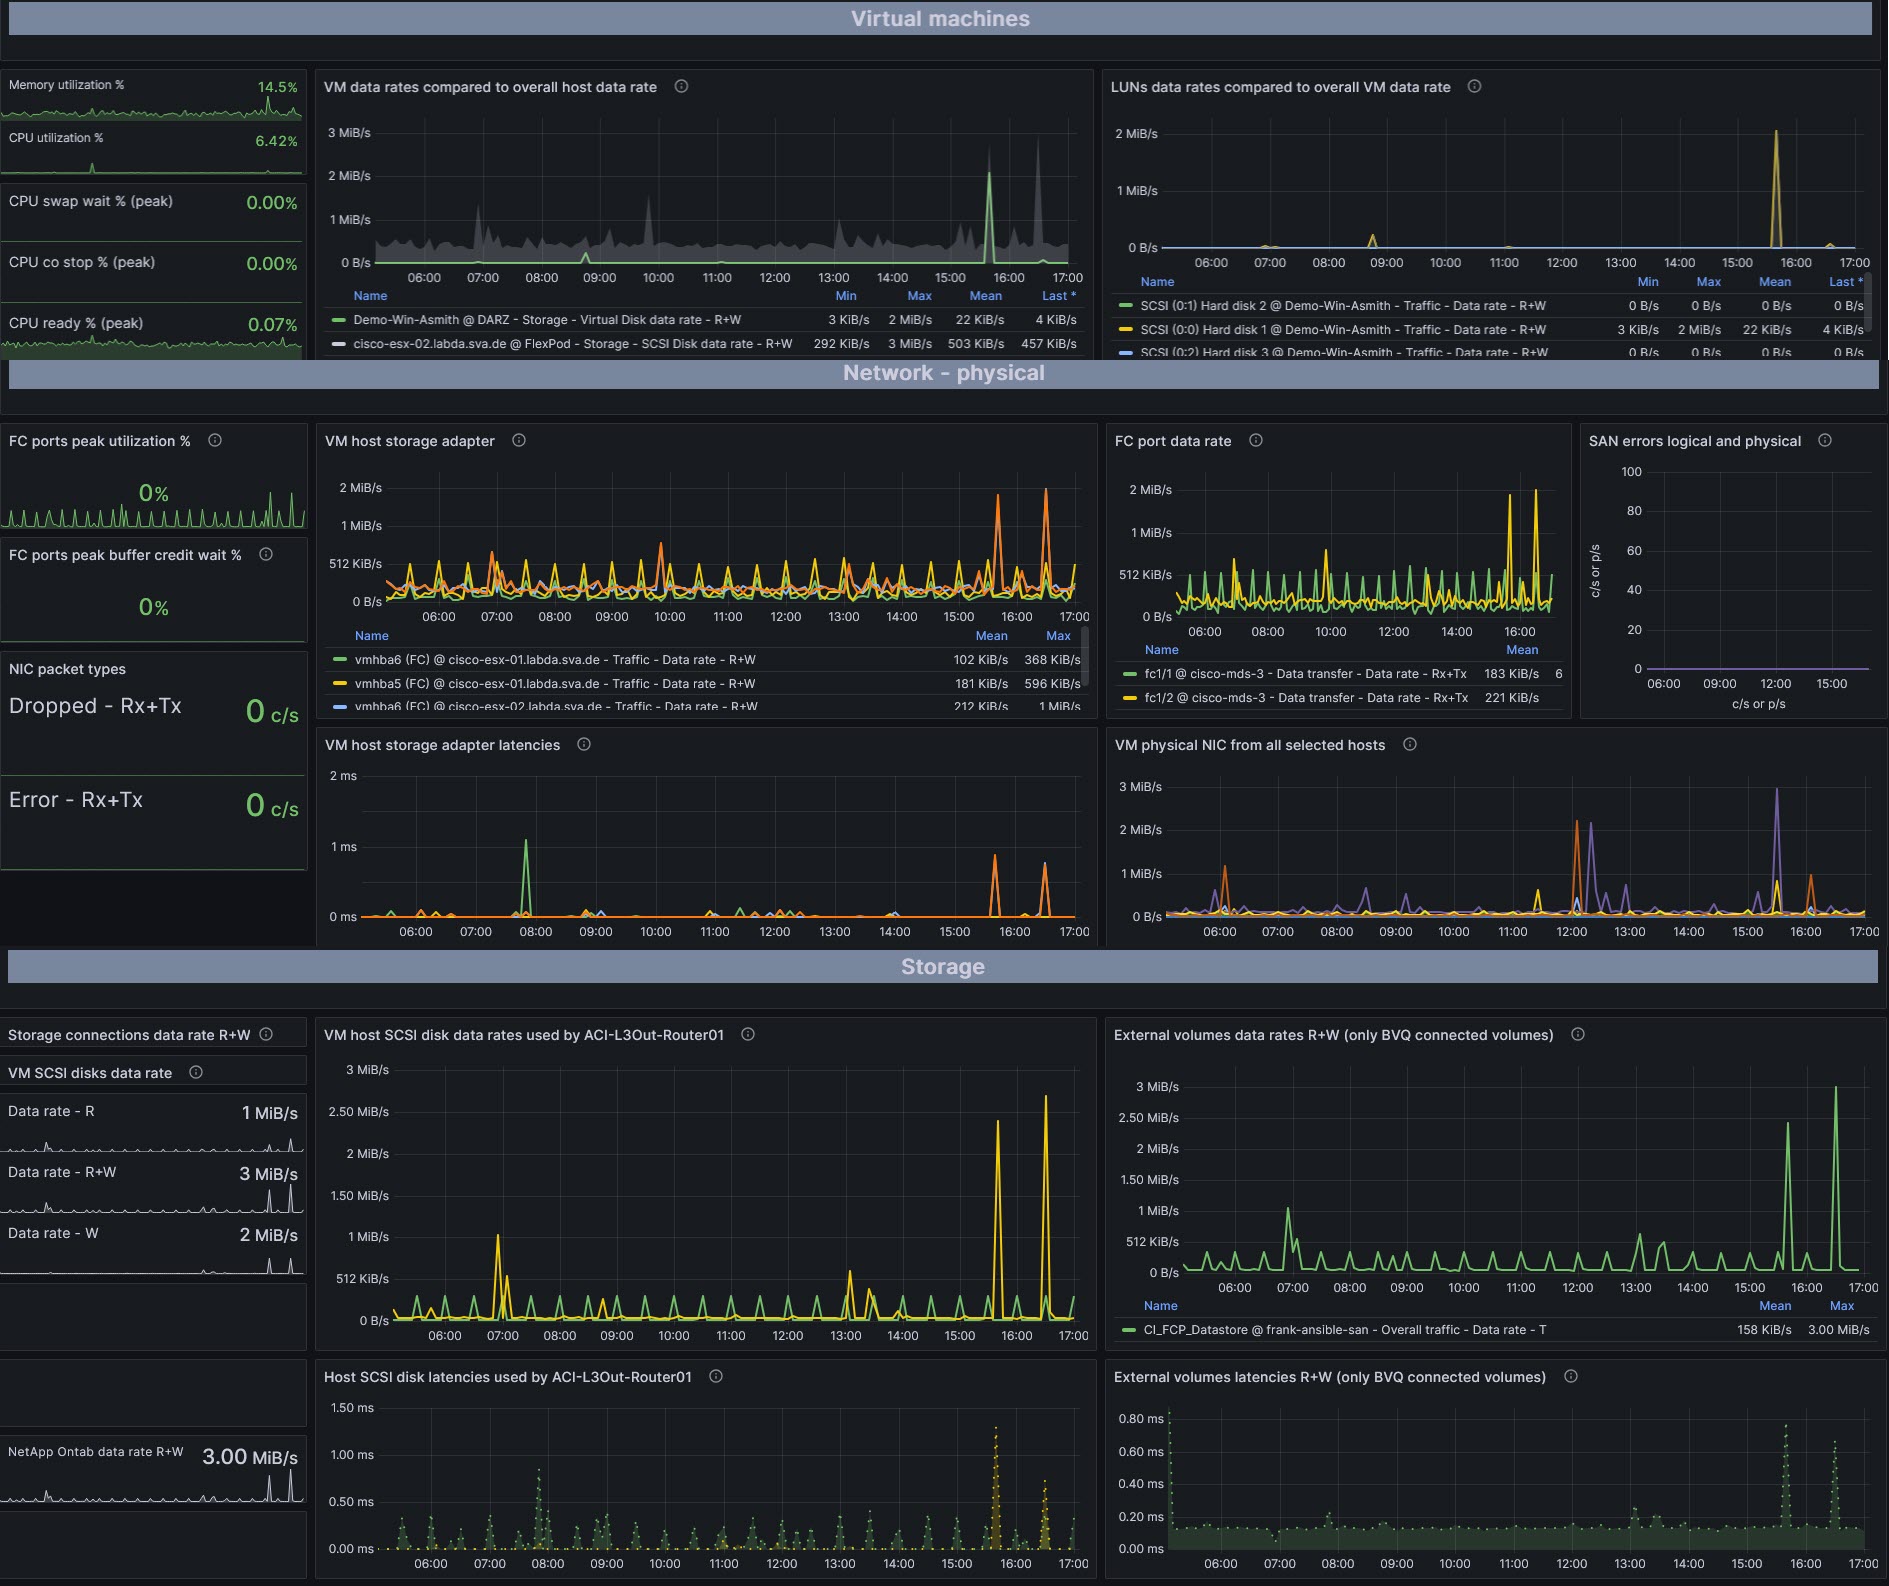
BVQ enables the identification of performance issues with insight offered by dashboards for VMware and NetApp Storage. This is essential to bridge silos between departments allowing everyone on the team to be on the same page and collaborate to meet SLAs.
Gain insight into:
-
VMware Host, virtual machines, and resources
-
Real time and historical performance and capacity
-
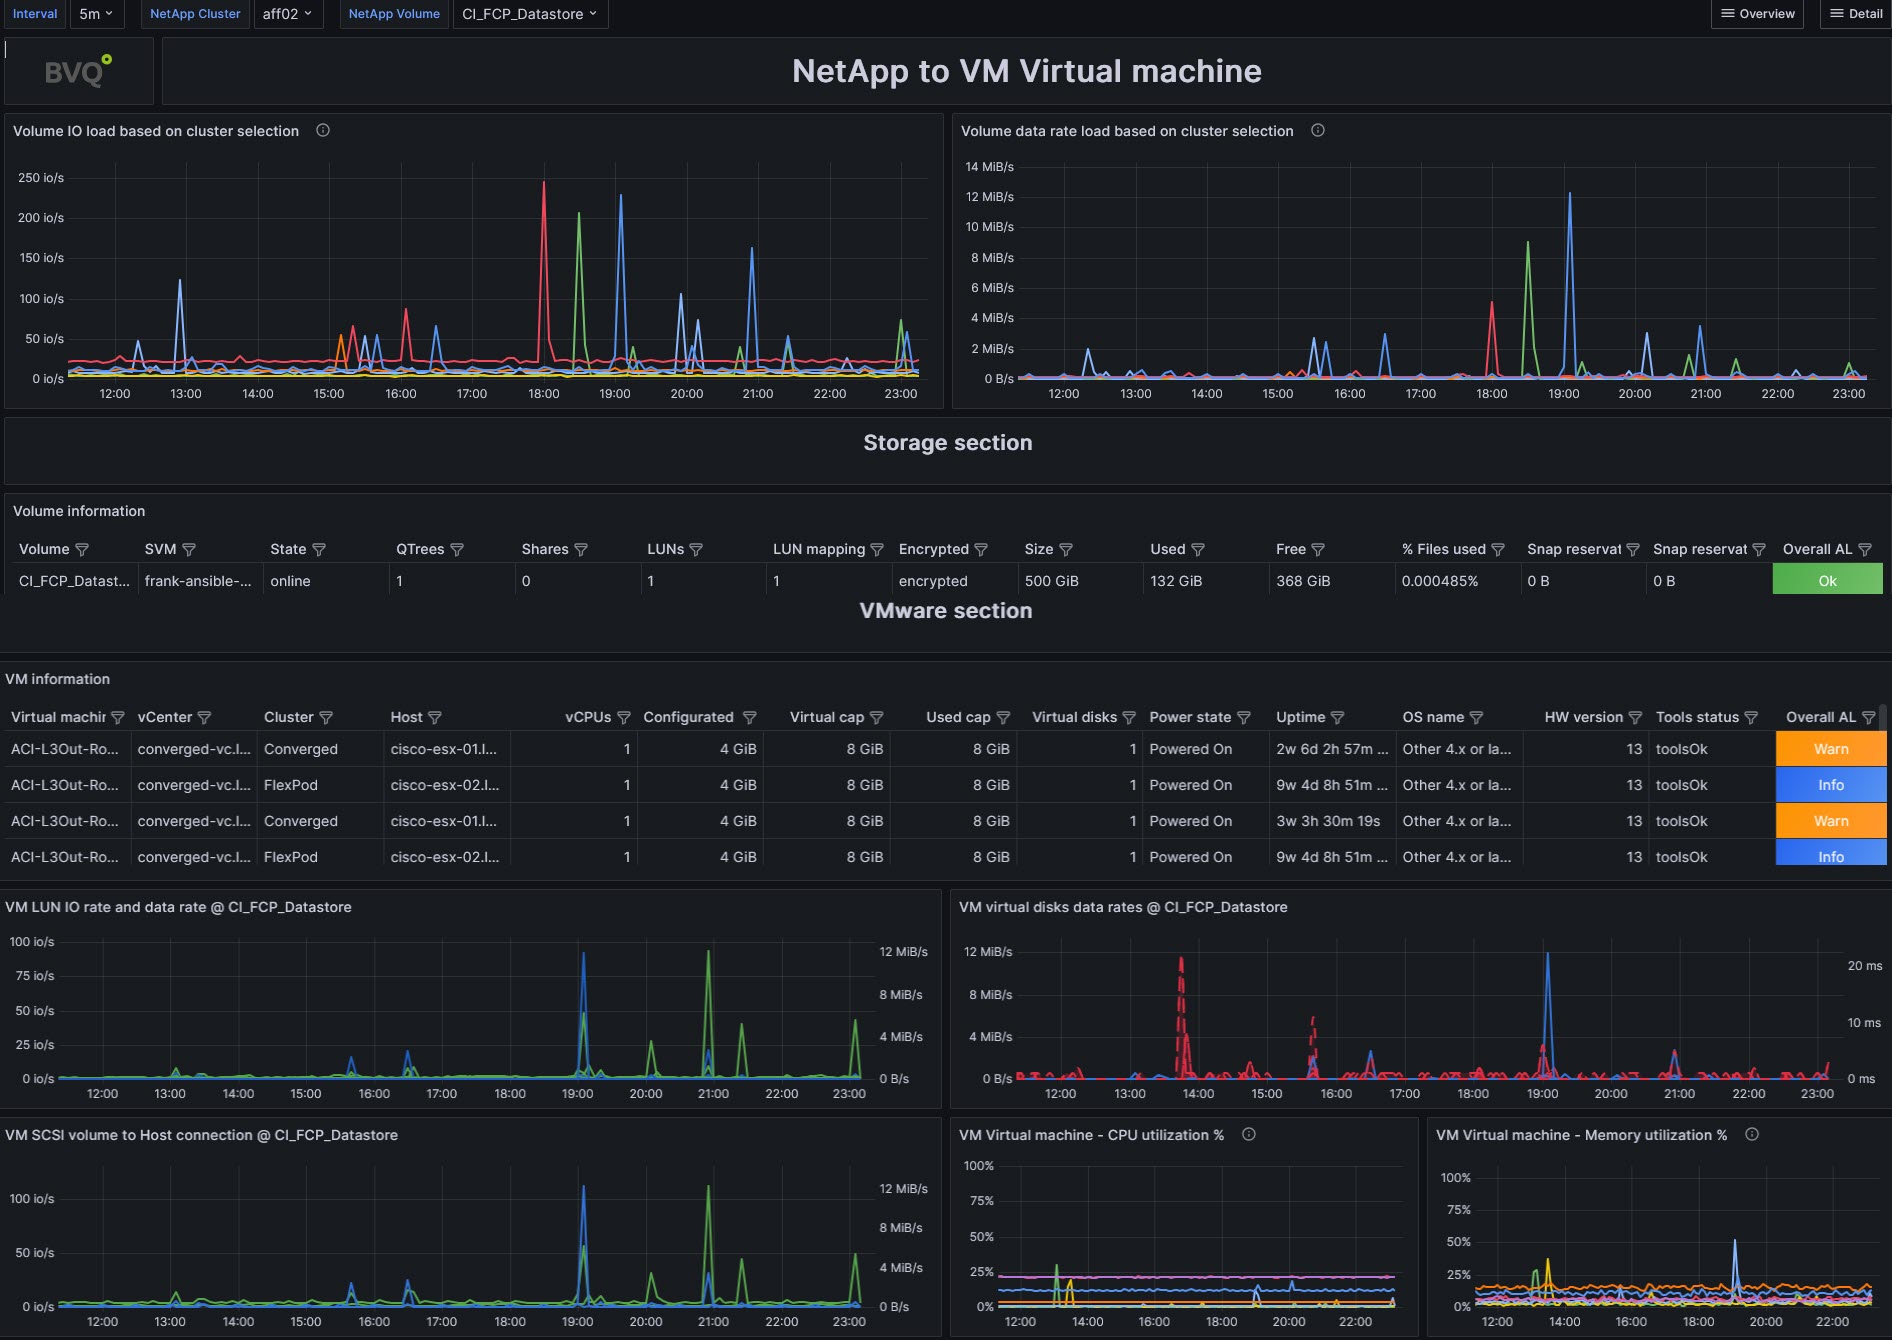
Views showing VMs that are generating higher load on NetApp volumes
-
Relevant metrics to find root-cause by analyzing performance
the NetApp Storage volumes used by VMware
Use Cases
Save time looking for the status of the critical areas, see the VMware/vSAN environment information you really need.
How busy are the VMware systems, are there bottlenecks or risks?
See which VMs are overloading the infrastructure due to memory or CPU contingencies and thereby affect other VMs. Identify VMs you can reclaim CPUs and memory from.
How can I prove a problem is inside or outside VMware?
Troubleshoot quickly and determine if the issue originates in the VMware area or is it problems in the external storage. Identify bottlenecks in the NetApp Storage volumes to easily rule out a VM resource constraint.
The VMware and NetApp Storage dashboards help to:
-
See the data traffic within an end-to-end view: See the ESX host data -> to the VM-> to the LAN -> to the storage
-
Find bottlenecks in the data traffic from external storage to the individual hosts. See NetApp Storage volume -> to VM LUN
-
Identify VMs that are generating higher load on NetApp volumes
-
Compare the storage volume load, identify peaks in latency – follow the datapath to the VM that is using this volume
See how the NetApp Storage volumes are performing and pinpoint peaks in volume IO rates, data rates and latency.
Essential performance metrics from the NetApp Node up to the Volumes.
Views include:
-
Cluster CPU utilization
-
Cluster max FC and Ethernet port utilization
-
Cluster node disk utilization
-
Cluster used snapshot reservation
Stabilize and improve performance based on the insights gained from these metrics at the Host and VM level
VMware
Components
Performance Metrics*
Host
CPU
Utilization MHz & %
Memory
Utilization GB & %
Storage
Latency, SCSI Disk Data Rate
Virtual machine
CPU
Utilization %
CPU wait states (ready %, co-stop %, swap wait %)
Memory
Utilization %
Storage
Latency, SCSI Disk Data Rate
Virtual Disk
Data Rate
Traffic
IO Rate, Data Rate, latency, transfer size
Capacity
Allocated, virtual capacity and used capacity
SCSI Volume
IO Rate, Data Rate, latency, transfer size
Storage Adapter
IO Rate, Data Rate, latency, transfer size
Virtual NIC performance
Packets R & T, Data Rate Packets dropped
Supported Platforms
All Features
Discover everything
you can do with BVQ and VMware
Explore all the features and use cases of BVQ to turn your infrastructure data into answers.
Performance Monitoring
Enables real-time tracking of performance metrics across Kubernetes nodes and workloads, helping identify bottlenecks and optimize resource utilization.
Configuration Management
Assists in monitoring and managing configurations of Kubernetes components, ensuring they adhere to best practices and are optimized for performance.
Capacity Planning
Provides insights into cluster and workload capacity, aiding in effective resource allocation and future scaling decisions.
Proactive Issue Detection
Utilizes advanced analytics to proactively identify potential issues before they escalate, allowing for preemptive action and minimizing downtime.
Resource Utilization Analysis
Offers detailed views of resource usage, such as CPU, memory, and storage, helping to identify under or over-utilized resources for better balancing.
Integrated Health Overview
Combines data from various IT layers, including VMware and NetApp, to present an integrated view of the overall health status, facilitating comprehensive IT infrastructure management.
Alert Customization & Management
Allows users to tailor alerting mechanisms according to their specific needs, enabling them to set thresholds and parameters that trigger notifications for various performance and configuration issues.
Historical Data Analysis
Provides the capability to analyze historical performance data, enabling IT teams to identify trends and patterns over time.
An End-to-End & Comprehensive ITSM
Optimize your IT infrastructure
with BVQ today
Benefit from a unified infrastructure view and integrated expert guidelines, promoting optimal performance and best practice adherence. Contact us today!

